hvPlot Tutorial
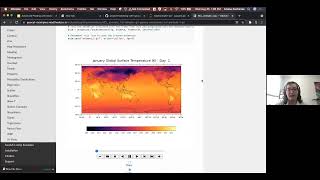
Author: HoloViz developersThe user guide provides a detailed introduction to the API and features of hvPlot. In the Introduction you will learn how to activate the plotting API and start using it. Next you will learn to use the API for tabular data and get an overview of the types of plots you can generate and how to customize them; including how to customize interactivity using widgets. Next is an overview on how to display and save plots in the notebook, on the commandline, and from a script. Another section will introduce you to generating subplots from your data. Once the basics are covered you can learn how to use the plotting API for specific types of data including streaming data, gridded data network graphs, geographic data, and timeseries data.


